Sliding-scale pricing is one of the most powerful things a community arts organization can do. It says to your community: we want you here, and cost shouldn't be the thing that keeps you out. But for the people running the programs, tiered pricing can feel like a leap of faith. If too many students pick the lower tier, does the class lose money? If nobody picks the higher tier, was it worth offering?
The Class Price Calculator takes the guesswork out of this. It models exactly how many supported-price seats your class can absorb at every enrollment level, so you can offer accessibility with your eyes wide open. If you want to understand the philosophy behind sliding-scale pricing in more depth, our article on sliding-scale pricing covers the research and the reasoning. This guide is purely practical: here's how to set it up in the tool.
1 Enable Tiered Pricing
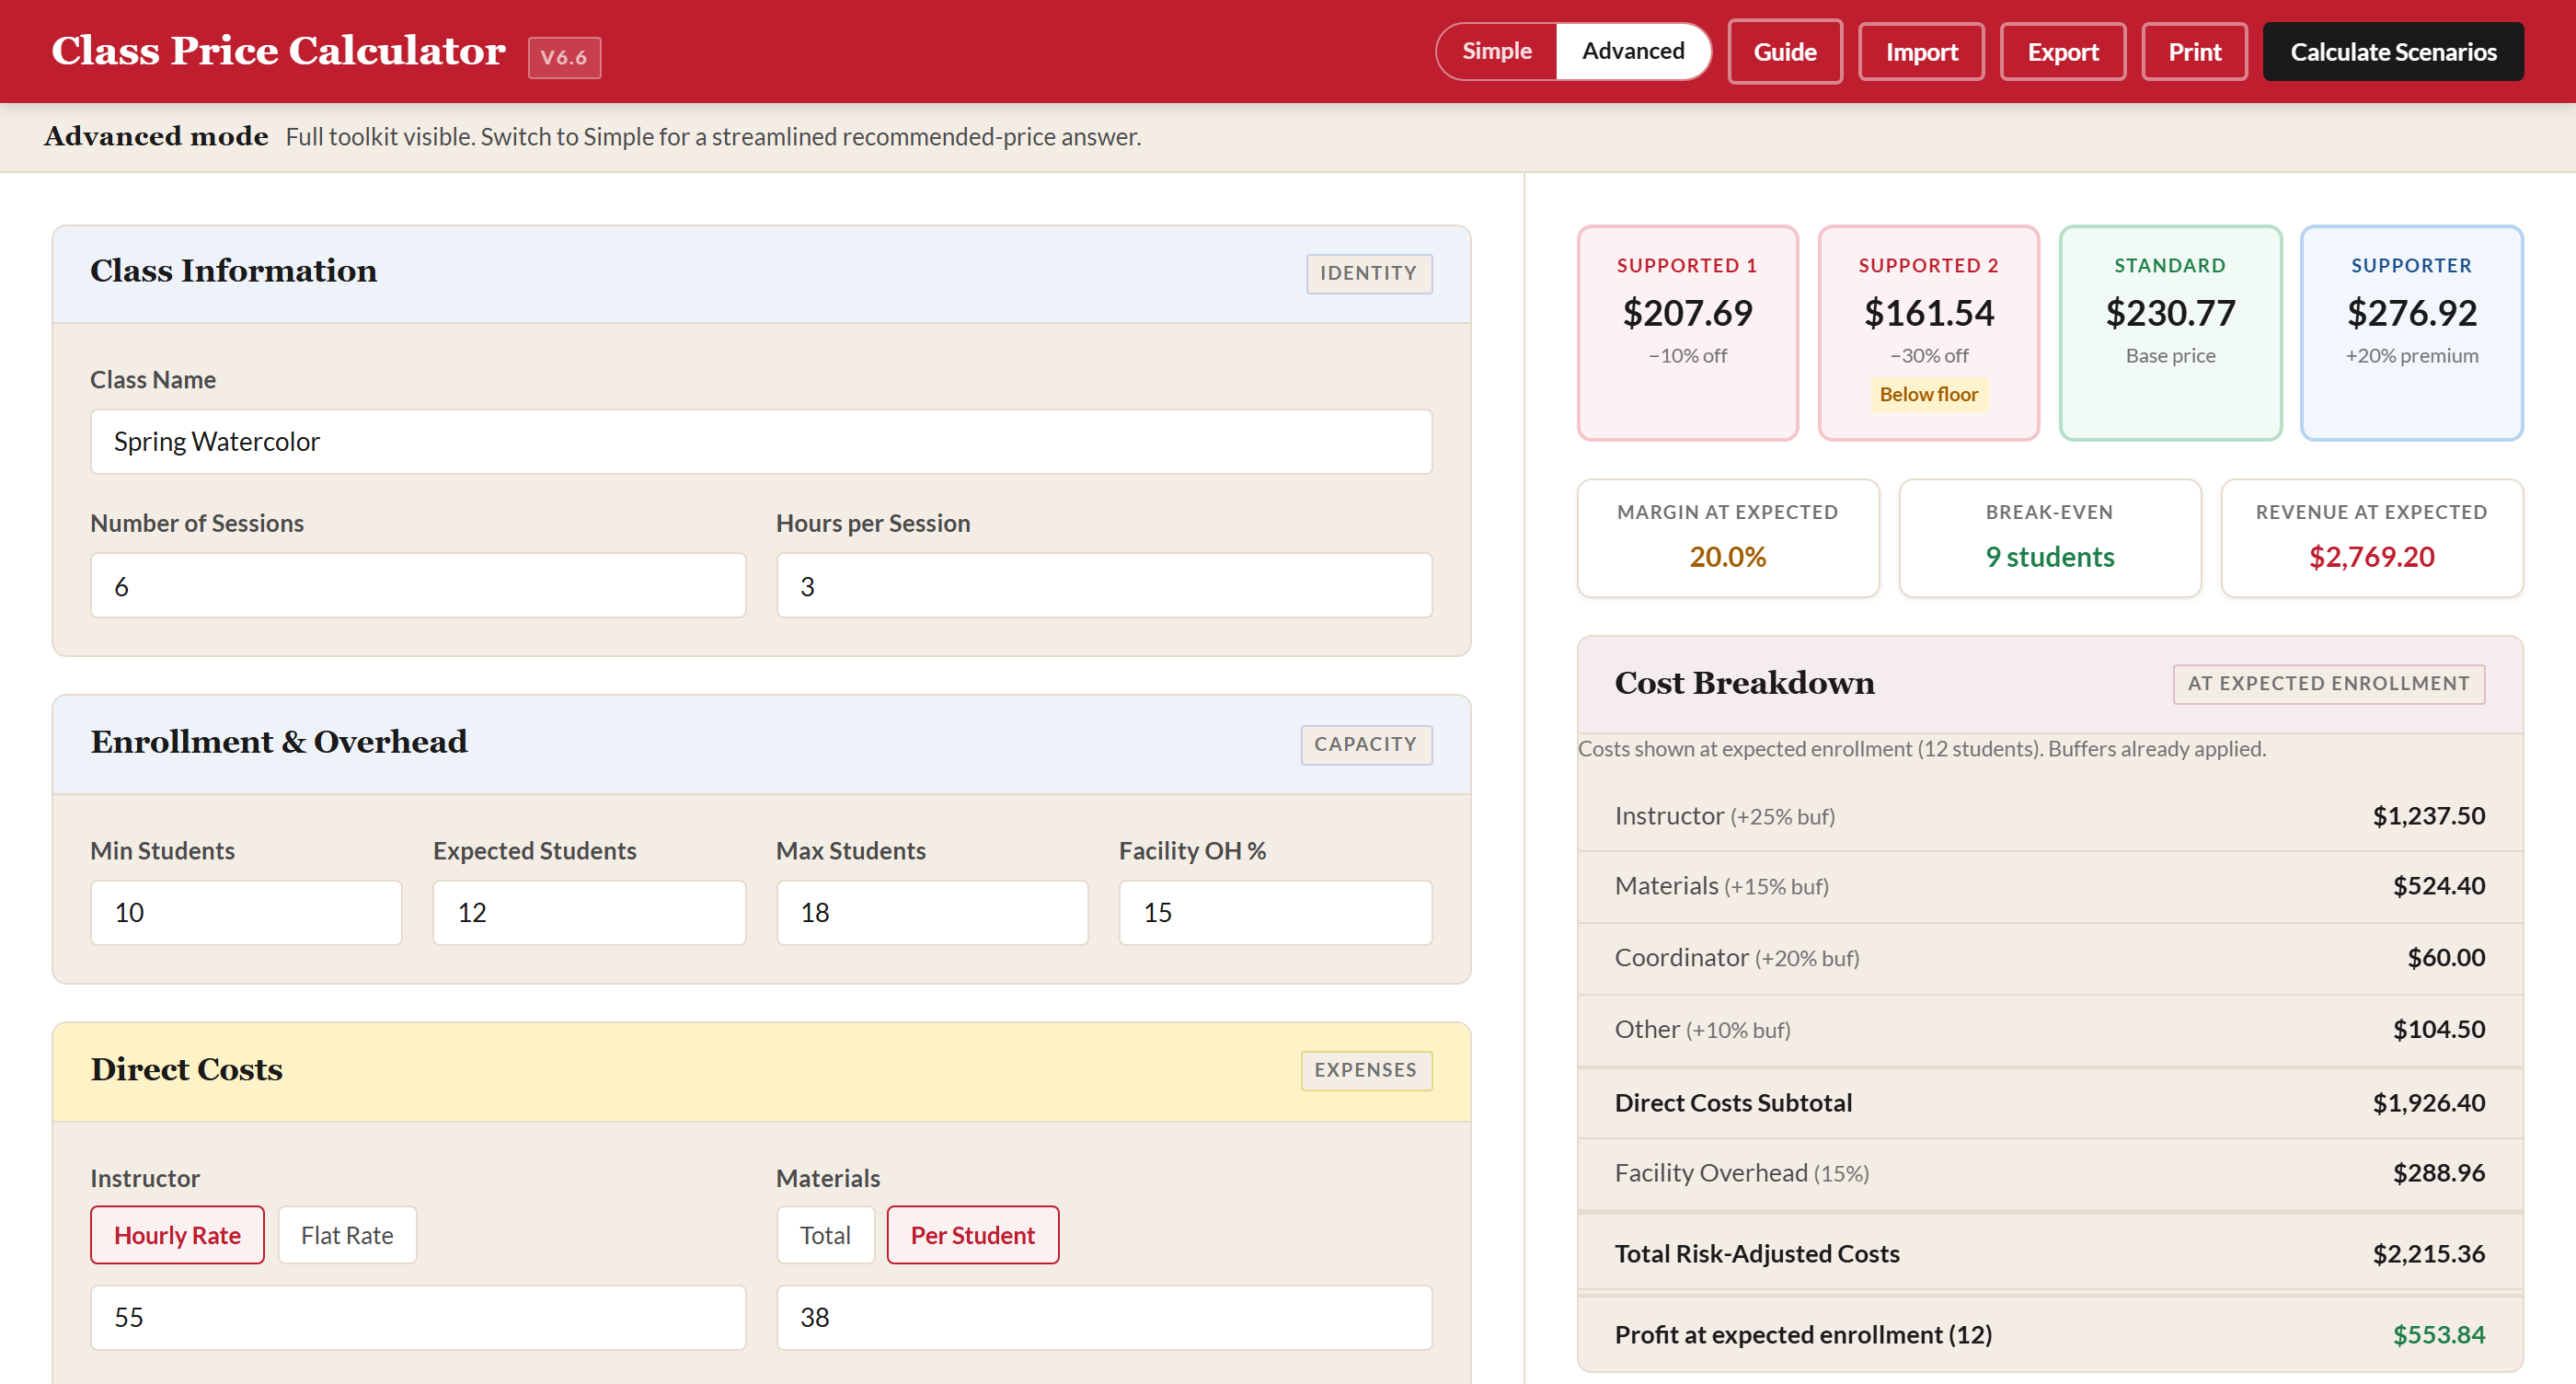
One thing to know first: tiered pricing lives in Advanced mode. If you're a fresh user, the tool opens in Simple mode by default, and the Tiered Pricing section is hidden. Click the Advanced segment in the header toggle (next to the Calculate Scenarios button) before you start this guide. The mode banner just below the header will switch from cream to parchment to confirm.
Before you can configure tiers, you need to toggle the feature on. In the left-hand input panel, scroll down to Section 6: Tiered Pricing. You'll see a simple toggle labeled "Enabled / Disabled." Click it to switch to Enabled.
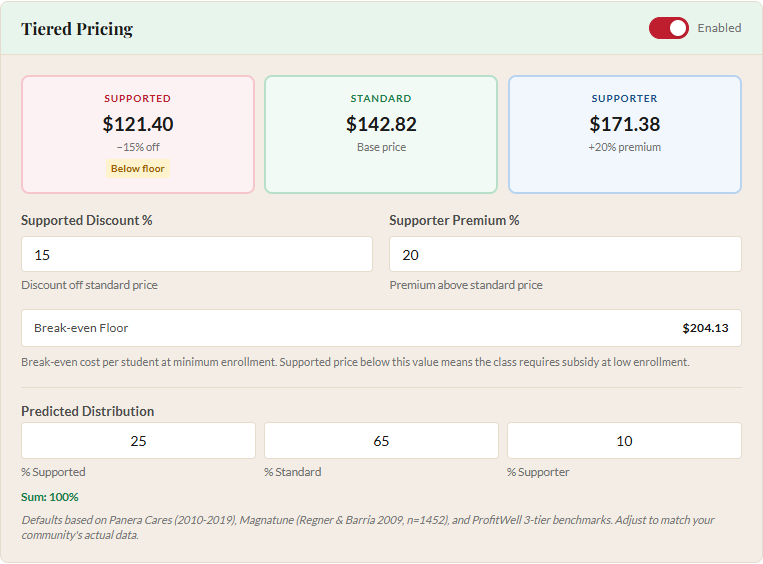
Once enabled, you'll see:
- A Number of Tiers input. Choose 3 (the default, Supported / Standard / Supporter) or 4 (which adds a second discount level).
- A Tier Names panel. The labels are editable, so if your community calls them something else, you can rename here and the change flows into every place the tool talks about tiers, including the pricing copy it generates for your booking platform.
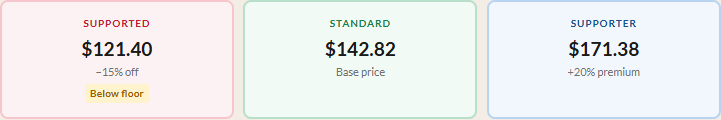
- Tier boxes showing the price at each tier.
- One Discount % input per scholarship tier and a single Supporter Premium % input.
- A Break-even Floor indicator showing the minimum viable per-student price.
The tier boxes update in real time as you change the discount and premium values. You don't need to click "Calculate" to see the tier prices. They recalculate instantly.
2 Choose 3 or 4 tiers
We run most of our classes at Lander on three tiers. Supported, Standard, Supporter. It's enough range to mean something and few enough choices that the person standing at the checkout page doesn't freeze. Three tiers also matches what every published study of pay-what-you-can pricing has measured. We have research-based defaults that work.
Four tiers exist for the cases where one discount tier isn't enough. If we're running a class that costs $300 at the standard rate and we know some people in our community can pay $250 but not $300, while others need a much steeper subsidy to afford it at all, two discount levels lets us reach both groups. The structure becomes Supported 1 / Supported 2 / Standard / Supporter, and the second supported tier is typically a deeper discount than the first.
Our board chair and our executive director both pushed back on adding a fifth tier. Their concern: more choices at checkout means more people freeze and don't enroll at all. We agreed. The tool caps at four for that reason.
One thing to know if you switch from 3 to 4 in a class you've been working on: the change wipes your tier names and percentages back to defaults. Each tier position has a specific meaning (deepest discount, Standard, Supporter), so keeping partial settings across the switch would be more confusing than useful.
3 Set Your Discount and Premium
The fields that control the spread between your tiers:
- Supported Discount % (or Supported 1 / Supported 2 Discount % in 4-tier mode) is the percentage below the standard price each scholarship tier pays. The default is 15% in 3-tier mode. If your standard price is $200, the supported price would be $170. In 4-tier mode, both discount inputs default to 15%; the second one is typically set deeper (we usually use something like 10% and 30%, but adjust to your community).
- Supporter Premium % is the percentage above the standard price for supporters. The default is 20%, so that same $200 class would cost $240 at the supporter tier.
If you're just starting out with tiered pricing, 15% and 20% are solid defaults. They're generous enough to feel meaningful to the student choosing the supported tier, and modest enough that the supporter tier doesn't feel excessive. As you run more classes and collect actual tier-split data (more on that below), you can adjust based on what your community actually does.
What if the supported price drops too low?
Below the discount and premium fields, you'll see the Break-even Floor. This is the cost per student at your minimum enrollment level, the absolute lowest price at which the class covers its costs with no margin at all.
If your supported discount pushes the supported price below this floor, the tool shows a "Below floor" badge on the Supported tier box. This is a warning, not a block. The calculator still shows you the true discounted price. It simply flags that at minimum enrollment, if every seat were filled at the supported price, the class would need subsidy.
This is useful information, not a reason to panic. In practice, not every seat will be at the supported tier, which is exactly why the sustainability analysis (Step 6) is so important.
In 4-tier mode each scholarship tier has its own floor check. If the steeper discount pushes one tier below the floor while the gentler discount stays above, only the affected tier shows the warning. That helps when we're trying to figure out where the practical ceiling on a second discount tier sits.
4 Set the Predicted Tier Distribution
Below the discount and premium fields, you'll find input fields under Predicted Distribution, one per tier:
- In 3-tier mode: % Supported (default 25), % Standard (default 65), % Supporter (default 10).
- In 4-tier mode: one field per tier (Supported 1, Supported 2, Standard, Supporter), all starting blank. Enter values that fit your community.
The percentages must add up to 100%. A validation indicator below the fields turns green when the sum is correct and red when it's off.
The 3-tier defaults come from real-world research on pay-what-you-can models: Panera Cares' experience from 2010 to 2019, Magnatune's data from a study of 1,452 transactions, and ProfitWell's three-tier benchmarks. They represent a conservative starting point. Roughly a quarter of your class at a discount, about two-thirds at full price, and one in ten choosing to pay more.
The 4-tier inputs start blank because no published research measures four-tier pay-what-you-can splits. We can't import someone else's data. Either you have your own history with a four-tier setup, or you make an honest guess.
These numbers drive the Predicted Tier Distribution table (Step 8 below). If you've been running tiered classes and have actual data from your Class History, the tool will eventually offer to replace these research defaults with your real numbers. Aggregate learning currently covers 3-tier classes; 4-tier aggregation arrives once enough of your data has those four buckets to justify the form change.
5 Calculate and Review Scenarios
With tiered pricing enabled, click "Calculate Scenarios" in the header bar. The calculator generates your standard enrollment scenarios table and also produces two additional tables that only appear when tiered pricing is on:
- Supported-Seat Sustainability
- Predicted Tier Distribution
Both tables appear below the main enrollment scenarios. Each one is covered below.
6 Read the Sustainability Analysis
The Supported-Seat Sustainability table answers a specific question: at each enrollment level, how many supported-price seats can my class absorb before it stops being viable?
The table has five columns:
| Column | What It Means |
|---|---|
| Enrollment | Total students in the class at this level |
| Max [tier name] (Break-even) | Most seats at this tier the class can absorb and still cover costs (zero margin). The tier-name shown in the header is whichever scholarship tier has the deepest discount. In 3-tier mode that's always "Max Supported"; in 4-tier mode it'll typically be "Max Supported 2". |
| % of Class | That number as a percentage of total enrollment |
| Max [tier name] (Target Margin) | Most seats at the deepest scholarship tier while still hitting your target profit margin |
| % of Class | That number as a percentage of total enrollment |
The calculation uses a conservative assumption: it assumes all remaining seats (non-supported) pay the Standard price, not the Supporter price. This gives you a floor estimate. If some students do choose the supporter tier, the real number of absorbable seats will be even higher.
In 4-tier mode the math uses the steepest available discount as the conservative case. If you have a 10% Supported 1 and a 30% Supported 2, the table answers "how many seats can the class absorb if all of them take the 30% off?" In practice fewer will take the deeper discount, so the table is a worst-case ceiling rather than a prediction.
Look at the row for your expected enrollment. If the deepest-tier column shows 2 or 3 seats in a class of 10, you know you can comfortably offer the supported tier to a meaningful number of students without sacrificing your financial targets. That's the data you need to offer accessibility with confidence.

7 Two-Tier Mode
Some registration systems only support two pricing levels. Sawyer, for example, lets you set a standard price and a single promotional code for a supported price. There's no built-in way to offer a third tier.
To use the calculator in two-tier mode, set the Supporter Premium to 0%. The supporter tier box disappears, and all the downstream tables and framing language adjust automatically. The sustainability analysis still works. The predicted distribution still works (just set the supporter percentage to 0 and split the remainder between supported and standard). The tier framing language generator will produce two-tier copy instead of three.
This works whether you're in 3-tier or 4-tier mode structurally. 4-tier with supporterPremium=0 gives you two discount levels and Standard, no Supporter tier in the customer-facing copy.
Two-tier mode isn't a compromise. It's the right configuration when your booking system has a two-tier constraint, and the tool supports it fully.
8 Read the Predicted Tier Distribution Table
This table models what your blended revenue would look like if students select tiers at the percentages you predicted in Step 4. It's your best estimate of real-world revenue before you've run the class.
The table has nine columns in 3-tier mode (ten in 4-tier mode, since the second supported tier gets its own column):
| Column | What It Means |
|---|---|
| Enrollment | Total students at this level |
| Sup'd (or Sup'd 1 / Sup'd 2 in 4-tier mode) | Number of students at each scholarship price (rounded from your predicted %). User-customized tier names appear here verbatim if you've renamed them. |
| Std | Number at the standard price |
| Sup'r | Number at the supporter price |
| Blended Revenue | Total revenue mixing all three tier prices |
| Costs | Total costs at this enrollment level |
| Profit | Blended revenue minus costs |
| Margin | Profit as a percentage of blended revenue |
| vs All-Std | Percentage difference between blended revenue and what you'd earn if every student paid the standard price |
The vs All-Std column is especially revealing. With the default 25/65/10 split, you'll typically see a small negative number, often around -2% to -4%. That's the actual cost of offering accessibility at this distribution. In our experience at Lander, a 3% revenue reduction is a small price for the mission alignment and community goodwill that tiered pricing creates.
If the vs All-Std column shows a positive number, it means the supporter premium more than compensates for the supported discount. This can happen when you have a generous supporter premium and a small predicted supported percentage.
9 Putting It All Together
Once you've reviewed the sustainability and predicted distribution tables, you have everything you need to make a confident decision about tiered pricing. You know your tier prices. You know how many supported seats the class can absorb. You know what your blended revenue looks like. And you know the real cost, as a percentage of revenue, of offering accessibility.
Setting up tiers is the first half. The second half is communicating them well and tracking what actually happens. From here, you'll want to:
- Generate framing language for your registration page. The right words matter more than you might think. See our guide to tier framing language.
- Track your actuals after the class runs. Save the plan to your Class History, then come back to enter real enrollment and tier-split data. Over time, the tool replaces research defaults with your own numbers. See our guide to tracking actuals.
Ready to price your next class?
Open the Class Price Calculator and put this guide into practice.
Open the Calculator