The main calculator starts with your costs and builds up to a price. That's the right approach when you're pricing a class from scratch. But sometimes the question isn't "what should I charge?" It's "can I charge $150 and still make this work?"
Maybe you've seen what other organizations charge for similar classes. Maybe someone in your organization set a price range. Maybe you simply have a gut feeling about what your community will pay, and you need to know whether the math supports it. The reverse calculator, called Target Price Analysis in the tool, is built for exactly these situations.
Mode note: The Reverse Calculator is an Advanced mode feature. If you don't see a "Target Price Analysis" section in the input panel, flip the header toggle to Advanced. Your preference is remembered across visits.
1 When to Use It
The reverse calculator is most useful in three situations:
- Competitive pricing: You've looked at what other studios or community centers charge for a similar class, and you want to match or undercut that price. The reverse calculator tells you whether that price covers your specific costs.
- Price constraints: Someone in your organization, a grant, or a venue agreement has set a price ceiling. You need to know if you can deliver the class at that price without losing money.
- Gut-check validation: You've been running this class for a while and "just know" what people will pay. The reverse calculator confirms whether your intuition aligns with your actual costs.
In all three cases, the workflow is the same: you already have a price in mind, and you want to stress-test it against reality.
2 How It Works
Before using the reverse calculator, you should have already filled in your costs and calculated your forward scenarios. The tool needs your cost data to tell you anything useful about a target price.
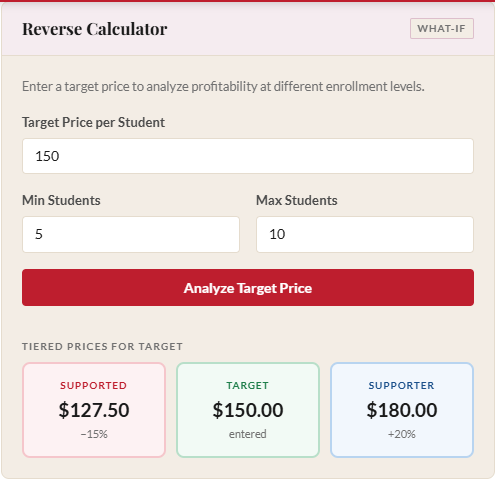
Scroll down to the Target Price Analysis section in the results panel. You'll see four fields:
- Target Price: The per-student price you want to test.
- Min Students: The low end of the enrollment range for this analysis (defaults to 5).
- Expected Students: The enrollment you realistically expect. This number powers the "Profit at expected enrollment" summary so you see the bottom-line answer at a glance without hunting through the table.
- Max Students: The high end (defaults to 10).
Enter your target price and click "Analyze Target Price." The tool generates a table showing what happens at every enrollment level in your specified range, with your expected-enrollment row marked and a summary line above the table showing exactly what you'll earn at that scenario.
3 Reading the Results Table
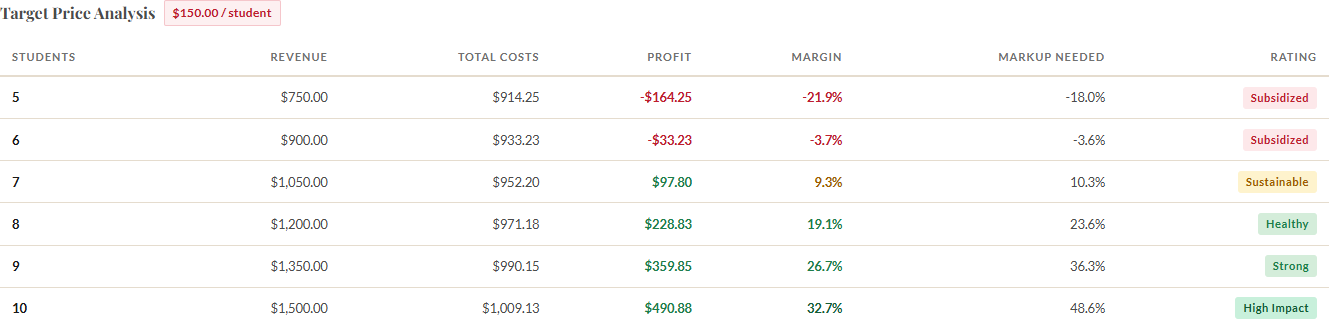
The Target Price Analysis table has six columns:
| Column | What It Means |
|---|---|
| Students | Enrollment level for this row |
| Revenue | Target price multiplied by this enrollment level |
| Costs | Total costs at this enrollment level (including buffers and overhead) |
| Surplus / Shortfall | Revenue minus costs. Positive means surplus. Negative means shortfall. |
| Margin | Surplus as a percentage of revenue |
| Rating | A label (High Impact, Strong, Healthy, Sustainable, or Subsidized) based on the margin |
4 Understanding Green vs. Red Rows
Rows with a positive surplus appear in green tones. These are enrollment levels where your target price more than covers costs. The larger the surplus, the more room you have for unexpected expenses, refunds, or reinvestment into future programming.
Rows with a negative surplus (a shortfall) appear in red. These are enrollment levels where the class loses money at your target price. A shortfall doesn't necessarily mean you can't charge that price. It means you need enough students to reach the green rows, or you need to accept the shortfall as a subsidy from other revenue sources.
The practical question is: look at the enrollment levels you realistically expect. If those rows are green, you're good. If the row at your expected enrollment is red, the target price doesn't work unless you can increase enrollment or reduce costs.
5 Reverse Sustainability (Tiered Pricing)
If you have tiered pricing enabled, the reverse calculator goes one step further. Below the main target price table, a Reverse Sustainability table appears. This shows how many supported-price seats your class can absorb at the target price rather than at the cost-based price.
The columns mirror the forward sustainability analysis: enrollment, max supported seats at break-even, percentage of class, max supported seats at target margin, and percentage of class. The difference is that the standard price in this table is your target price, not the calculator's recommended price.
This is useful when you're working backward from a round number. If you want to charge $150 instead of the calculator's recommended $172.53, the reverse sustainability table shows you how that lower price affects the number of supported seats you can offer. You might find that at $150 you can still absorb 2 supported seats at target margin, which is enough for your community's needs.
6 Using Reverse Results to Make Decisions
The reverse calculator is a negotiation tool, both with yourself and with external stakeholders. Here are some of the conversations it enables:
- "I can charge $150 if I find 2 more students." Look at where the green rows start. If $150 is red at 8 students but green at 10, you know the enrollment threshold you need to hit.
- "The decision was $120, but that requires 14 students." If your studio only holds 12, the target price doesn't work. You now have data to bring back to the conversation instead of a gut feeling.
- "The competitor charges $180, and our cost-based price is $165." The reverse calculator shows you what happens at $180. You might discover a comfortable surplus that you can direct toward scholarships or equipment.
The power of the reverse calculator is that it transforms vague pricing discussions into specific, number-backed decisions. Instead of arguing about whether a price "feels right," you can point to the exact enrollment level where it becomes viable.
Ready to price your next class?
Open the Class Price Calculator and put this guide into practice.
Open the Calculator