A well-built spreadsheet can price a class. We started with one. Most teaching artists and program directors do, and there's nothing wrong with that. A Google Sheet or Excel workbook lets you list your costs, plug in an enrollment number, and divide. For a single class with straightforward expenses, that works fine.
But if you're pricing more than a couple of classes a year, or if you need to model enrollment scenarios or offer tiered pricing, you'll start to feel the limits. We did. This article walks through the honest trade-offs so you can decide what makes sense for your situation. No sales pitch, just what we've learned from doing it both ways.
What Spreadsheets Do Well
Before we get into limitations, let's give spreadsheets the credit they deserve. There are real reasons why so many of us start with them.
They're familiar. If you've ever made a budget or tracked expenses, you already know how to use one. There's no learning curve for the basics: type a number into a cell, write a SUM formula, done. That low barrier matters when you're already juggling lesson plans, marketing, and studio logistics.
They're free. Google Sheets costs nothing. LibreOffice Calc costs nothing. If you already have Microsoft 365, Excel is included. For someone testing a new class idea or pricing their first workshop, free is a compelling feature.
They're flexible. You can build whatever you want. Custom formulas for unusual cost structures, conditional formatting to flag problem areas, multiple tabs for different programs. A spreadsheet doesn't impose any structure on you, which is great if you have unusual requirements.
They work offline. A downloaded spreadsheet works without an internet connection, which matters if you're pricing classes at a retreat center in the mountains or on a plane ride to a conference. (We're in Lander, Wyoming. We get it.)
If you teach one class a semester with fixed costs and predictable enrollment, a spreadsheet may genuinely be all you need. No judgment. There's no reason to add complexity when the simple tool does the job.
Where Spreadsheets Fall Short
The limitations aren't about what spreadsheets can't do in theory. Given enough time and Excel expertise, you can build almost anything. What they make hard, though, tends not to get done.
No built-in scenario modeling
This is the big one. When you price a class in a spreadsheet, you get one answer at one enrollment level. But enrollment is rarely certain. You might get 6 students or you might get 14. The per-student price at those two levels is dramatically different, and so is your margin.
To see pricing across a range of enrollment levels in a spreadsheet, you need to either duplicate your formula block for every enrollment number you want to test, or build a data table with enrollment as a variable input. Both are doable but tedious, and they break when you change the underlying cost structure. Most people just don't bother. Which means they're making pricing decisions based on a single enrollment assumption that may not hold. (Ask us how we know.)
In our experience, the most common pricing mistake isn't charging too little. It's building a price around an enrollment number that doesn't materialize.
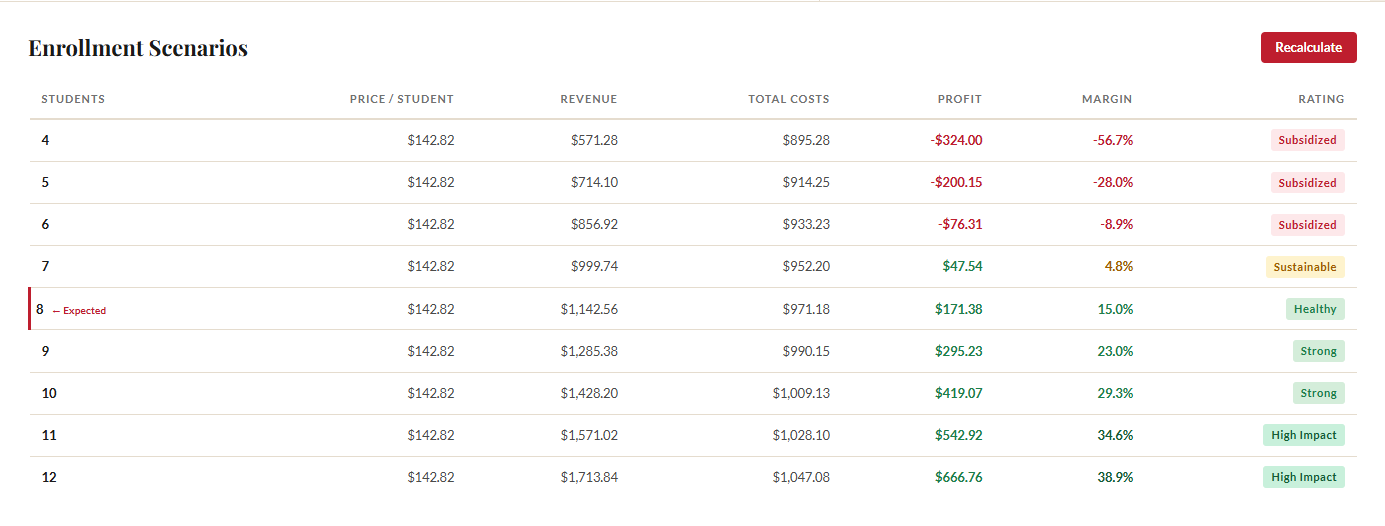
Class Price Calculator generates a full scenario table automatically: every enrollment level from your minimum to your maximum, with per-student pricing, total revenue, margin, and a risk rating for each row. You see the complete picture without building anything.
No tiered pricing logic
Sliding-scale or tiered pricing (offering a Supported rate below cost, a Standard rate at target margin, and a Supporter rate that subsidizes others) is increasingly common in arts education. It's also genuinely hard to build in a spreadsheet.
The challenge isn't just the math (though that's non-trivial). It's that tiered pricing interacts with enrollment scenarios. If 3 of your 10 students pay the Supported rate and 2 pay the Supporter rate, what happens to your margin? What if only 7 students enroll and the mix shifts? Building a spreadsheet that models tier distribution across enrollment levels requires nested formulas that break when you change inputs. And good luck handing that spreadsheet to the next program coordinator.
In Class Price Calculator, tiered pricing is a single toggle and two sliders. The tool handles the break-even floor automatically so your Supported tier never drops below cost, and every enrollment scenario in the table reflects the tiered pricing structure.
No per-category risk buffers
If you've been doing this a while, you know that not all costs carry the same risk. Instructor compensation is relatively predictable. Materials costs can spike if a supplier raises prices or a project eats more consumables than expected. Facility costs might include a damage deposit you may or may not get back.
Applying different buffer percentages to different cost categories (say, 10% on instructor pay, 25% on materials, and 15% on facility) is straightforward in a single cell. But propagating those buffers across a scenario table with multiple enrollment levels, and updating them when you change a buffer percentage? That's where spreadsheets start working against you. A missed cell reference or a broken formula can silently produce wrong numbers, and you might not catch it until you've already committed to a price.
No reverse price analysis
Sometimes you don't start with costs. Sometimes you start with a price. A venue or co-sponsor says they'll pay $185 per student. A parent survey suggests $220 is the ceiling. The pottery studio down the road charges $160. You need to work backwards: at that price point, what margin do you get at each enrollment level? Which costs would you need to cut to make it work?
In a spreadsheet, reverse analysis means rebuilding your pricing model backwards, or using Goal Seek (if you're in Excel and know it exists). Either way, you get a single answer, not a table showing margin at every enrollment level for a given price. Class Price Calculator has a dedicated reverse analysis mode that answers this in seconds.
Sharing and documentation
We've all been there: you open a pricing spreadsheet someone else built and stare at cells full of formulas with no context. Which cells are inputs? Which are calculated? What does the buffer percentage in cell D14 represent? Why is there a hardcoded 1.15 multiplier in the materials formula?
With Class Price Calculator, every input and output is labeled. The logic is embedded in the interface, not hidden in cell references. A new team member can open it, see labeled fields for instructor rate, session count, materials budget, and enrollment range, and understand immediately what each number means and how to change it.
Side-by-Side Comparison
| Feature | Spreadsheet | Class Price Calculator |
|---|---|---|
| True cost calculation | Manual formulas | Built-in |
| Enrollment scenarios (min to max) | Manual per row | Automatic (full range) |
| Tiered pricing (sliding scale) | Complex formulas | One toggle + 2 sliders |
| Risk buffers per category | Manual per cell | Preset or custom per category |
| Reverse price analysis | Rebuild spreadsheet | Built-in |
| Print-ready summary | Manual formatting | One click |
| Data privacy | Depends on platform | 100% local, zero data collection |
| Cost | Free | $0+ (pay what you want) |
A couple of notes on that table. Spreadsheets get "depends on platform" for data privacy because Google Sheets stores your data on Google's servers, while a local Excel file stays on your machine. Class Price Calculator runs entirely in your browser with no server communication, so your financial data never leaves your computer. Period.
On cost: both options can be free. We use a pay-what-you-want model starting at $0. The real comparison isn't about price. It's about whether the time savings justify switching from a tool you already have.

When You Should Switch
Here are the practical signals that your spreadsheet is costing you more time (or more money) than it's saving:
- You price more than 2 or 3 classes per year. The setup time for a well-built pricing spreadsheet is significant. If you're doing it repeatedly, a tool that handles the structure for you pays for itself in the first use.
- You need to justify pricing to someone else. A clean scenario table with margin percentages and risk ratings is way more persuasive than a spreadsheet someone has to squint at. The print view is designed for exactly that conversation.
- You want to offer tiered or sliding-scale pricing. If equity-based pricing is part of your mission, building the formulas from scratch every time is not a good use of your expertise. Let the tool handle the math so you can focus on the policy decisions.
- You've been surprised by enrollment math. If you've ever lost money on a class because fewer students enrolled than expected and you didn't model that scenario, automatic scenario generation would have caught it. That's not hypothetical. In our experience and from peers we trade notes with, it's one of the most common financial problems in community arts education.
- Someone else needs to use your pricing tool. If you're not the only person pricing classes at your organization, a self-documenting tool is safer than a spreadsheet that only its creator understands.
When a Spreadsheet Is Fine
We're going to be straight with you. Not everyone needs a dedicated pricing calculator, and pretending otherwise would be a waste of your time.
A spreadsheet is probably fine if:
- You teach one or two classes a year with the same basic cost structure.
- Your enrollment is predictable (a waitlisted class that always fills, for example).
- You don't offer tiered pricing and don't plan to.
- You're the only person who needs to understand or use the pricing model.
- Your costs are simple: instructor pay, materials, maybe a facility fee. No coordinator time, no marketing budget, no equipment depreciation.
If all five of those are true, a Google Sheet with a few formulas will serve you well. Seriously. Save your energy for teaching.
Most of us fall somewhere in between. You might start with a spreadsheet and discover, two or three semesters in, that you're spending an hour rebuilding it every time because the costs changed or you want to test a different enrollment range. That's the natural point to switch, and there's no rush to get there.
The goal isn't to use the fanciest tool. It's to price your classes accurately, quickly, and with enough confidence that you can focus on the work that actually matters: teaching.
Want to See the Difference?
Class Price Calculator shows you pricing at every enrollment level, with tiered pricing and risk buffers built in. Takes about 2 minutes to set up. Pay what you want, starting at $0.
Try Class Price CalculatorFrequently Asked Questions
Is there a free class pricing spreadsheet template?
You can build a basic one in Google Sheets: list your costs, sum them, divide by enrollment. But for scenario modeling across different enrollment levels, tiered pricing with break-even floors, and per-category risk buffers, a purpose-built calculator is faster and less error-prone. Class Price Calculator starts at $0 (pay what you want).
Can I import my spreadsheet data into Class Price Calculator?
Class Price Calculator uses JSON for import/export, not spreadsheet formats. But the inputs are simple enough (hourly rate, materials cost, sessions, enrollment range) that re-entering them takes about 2 minutes. The time you save on scenario modeling and tiered pricing more than makes up for it.